
In January, Medicare officials announced their goal for 85% of payments under that program, which covers approximately 50 million Americans, to be value-based by the end of 2016. This news was quickly followed by a commercial health plan industry task force announcement of a goal that 75% of its business would be in value-based payments by January 2020. Private and public payers have set the tone; some organizations within the health care delivery system are beginning to respond, but others are still evaluating how to react to a transforming environment. There are currently more than 600 accountable care entities operating in the U.S. that contract with commercial health plans, Medicare and Medicaid, and the number is still growing.
The explosion in growth of accountable care arrangements, led by hospital systems or physician organizations or a combination thereof, is permanently altering the traditional distinctions between healthcare payers and providers. Provider organizations are entering into risk-based contracts with health plans at a fast pace and larger systems have formed their own health plans. As roles shift and the lines of responsibility blur for functions like patient assessment, care coordination, risk-assessment and population health management, there is a much greater demand for data sharing and transparency in contractual relationships and organizational collaborations.
These new system dynamics are heavily impacting the approach to all data within the healthcare enterprise, with a significant change in focus on financial data. Traditional cost calculations of care episodes, procedures or therapies will still be used in this period of transition from fee for service to value-based payment and accountable care, but will become less impactful as more patients and providers are operating in an accountable care model that focuses on the total cost of care for a particular person over a specified period of time.
With the shift from volume-based to value-based care also comes a broadening of the services and provider types and settings that need to be measured and analyzed to effectively manage population health and the total cost of care. This includes adding data from healthcare and related service providers, which are outside of the acute care or ambulatory setting, but that nonetheless, have a great impact on an individual patient’s and a population’s healthcare costs and experience of care.
Now about those patients; to date, the Affordable Care Act has resulted in the enrollment of 17 million more people throughout the US, with a substantial portion of that number now having health insurance coverage for the first time ever or after several years without coverage. This, coupled with the steady growth in high-deductible plans, has resulted in an insured population of healthcare consumers who are more sensitive to cost and who will increasingly demand greater cost transparency. The aggregation, analysis and availability of healthcare cost data will need to respond to this new market for information and present it in a way that accurately and completely communicates the cost of care.
New Data and Analytics Capabilities
Since the federal HITECH Act began authorizing incentive payments in 2010, more than $30 billion in federal funds have been invested in electronic health records in the acute care and ambulatory settings, combined with billions more in capital and operational resources that provider organizations have allocated to these systems. The result is a national explosion in the volume of longitudinal, aggregated patient-specific data that is being stored in data repositories and mined for clinical insight in a way that was impossible just five years earlier. The combination of even the most basic clinical data: treatments, procedures, diagnostics, medications; with financial data across provider organizations, patient populations, metropolitan statistical areas, states and other segmentations can deliver insights on cost trends, effectiveness and population health faster than ever before. The speed at which this data can now be aggregated and analyzed is what makes it actionable and as such, an essential tool for the transformed healthcare sector.
Need for Interactive Data Roadmap
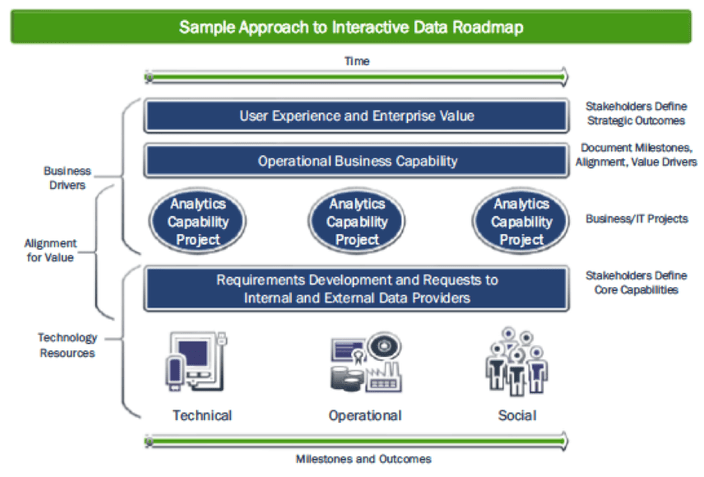
One of the most essential objectives for any healthcare organization that is aligning its operations with the transforming health system is the ability to determine value from data; that is, the ability to objectively measure quantifiable benefits from discrete activities in relation to their costs. The journey from one-dimensional reports and analysis in a volume-based ecosystem to multi-dimensional analytics infrastructure to support value-based payment and accountable care demands a well-designed roadmap that accurately depicts the current state and data inventory, identifies all significant milestones, measurements and progress markers along the way, and clearly illustrates the destination of analytics-enabled business outcomes. The roadmap should be accessible and useful to all of the analytics users whose behavior and decision-making is impacted by the transformation efforts.
In crafting the roadmap, it is worthwhile to deliberately consider what insight can be derived from existing data. Data analytics initiatives that start with the goal of acquiring as much data from as many sources as possible simply because it can be aggregated relatively easily and it is assumed to have value quickly bog down without that interactive roadmap. Focusing on key business functions and specific users, and what insights they need to adapt to a transformed healthcare system, is essential. In taking this first step, healthcare organizations can derive useful insight from the data they already have, simply by evaluating it through the lens of a value-based analysis instead of the traditional volume based calculation. These initial insights quickly but incrementally can evolve into enhanced analytics capability with the addition of new data streams and algorithms.
Granularity v. Aggregation
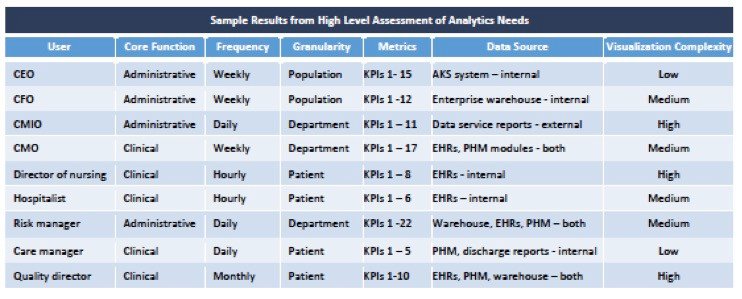
Determining the level of granularity vs. aggregation depends entirely on the business or clinical function and the user. This underscores the need to closely align and monitor the progression of the organization’s business plans with an IT and analytics strategy. What questions must be answered? Who within the organization needs the answers? How will behavior change as a result of answering the questions? How will the analytics capability support the ability to modify the questions over time to correspond to changing business and user priorities? The result of that analysis should be a matrix of attributes for each user and groups of users which can be constantly updated as their needs evolve.
An interactive data roadmap
The innovative healthcare and payment models and organizational structures developing and thriving today would not be possible without the technical infrastructure, enterprise architecture, advanced analytics software, and normalized data now available within and among healthcare organizations. An interactive data roadmap that aligns core business objectives with an IT and analytics strategy is an essential tool to successfully navigate the rapidly transforming U.S. healthcare system. The roadmap can make all the difference in whether and how an organization travels through this era of healthcare transformation.
About the Aptitude Software & Trexin Partnership
Aptitude Software and Trexin together offer unparalleled software and financial domain expertise coupled with strategic expertise to help clients capitalize on disruptive changes related to technological innovation, government regulation, organizational restructuring, and business-model shifts.
For more information on Aptitude Software for healthcare, please visit our healthcare industry page.
Download a PDF version here